Mini Program Debugging
Program debugging mainly has three functional areas: simulator, debugging tool, and mini program operation area.
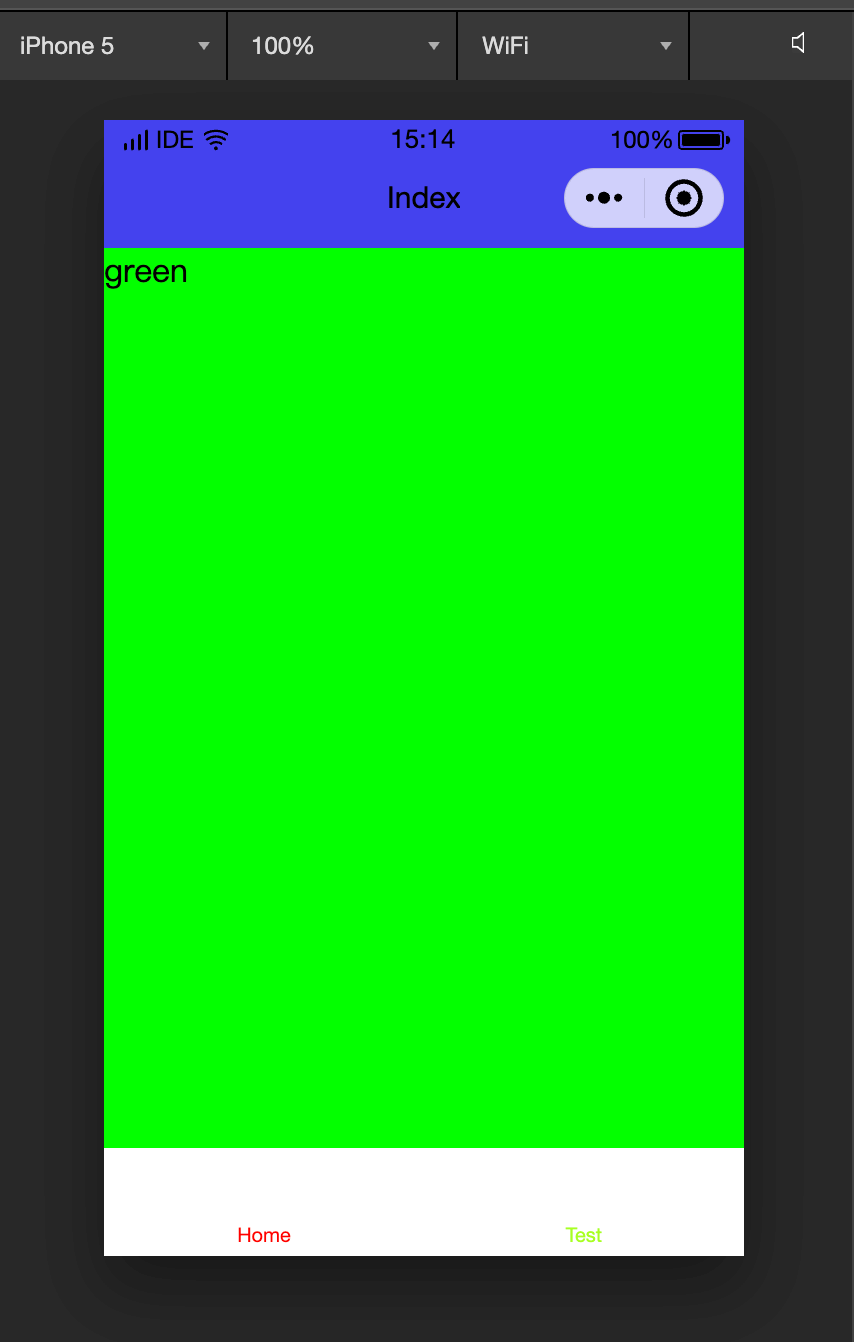
Simulator
The simulator simulates the real logical performance of the mini program on the client, and can present the correct state for most APIs on the simulator.
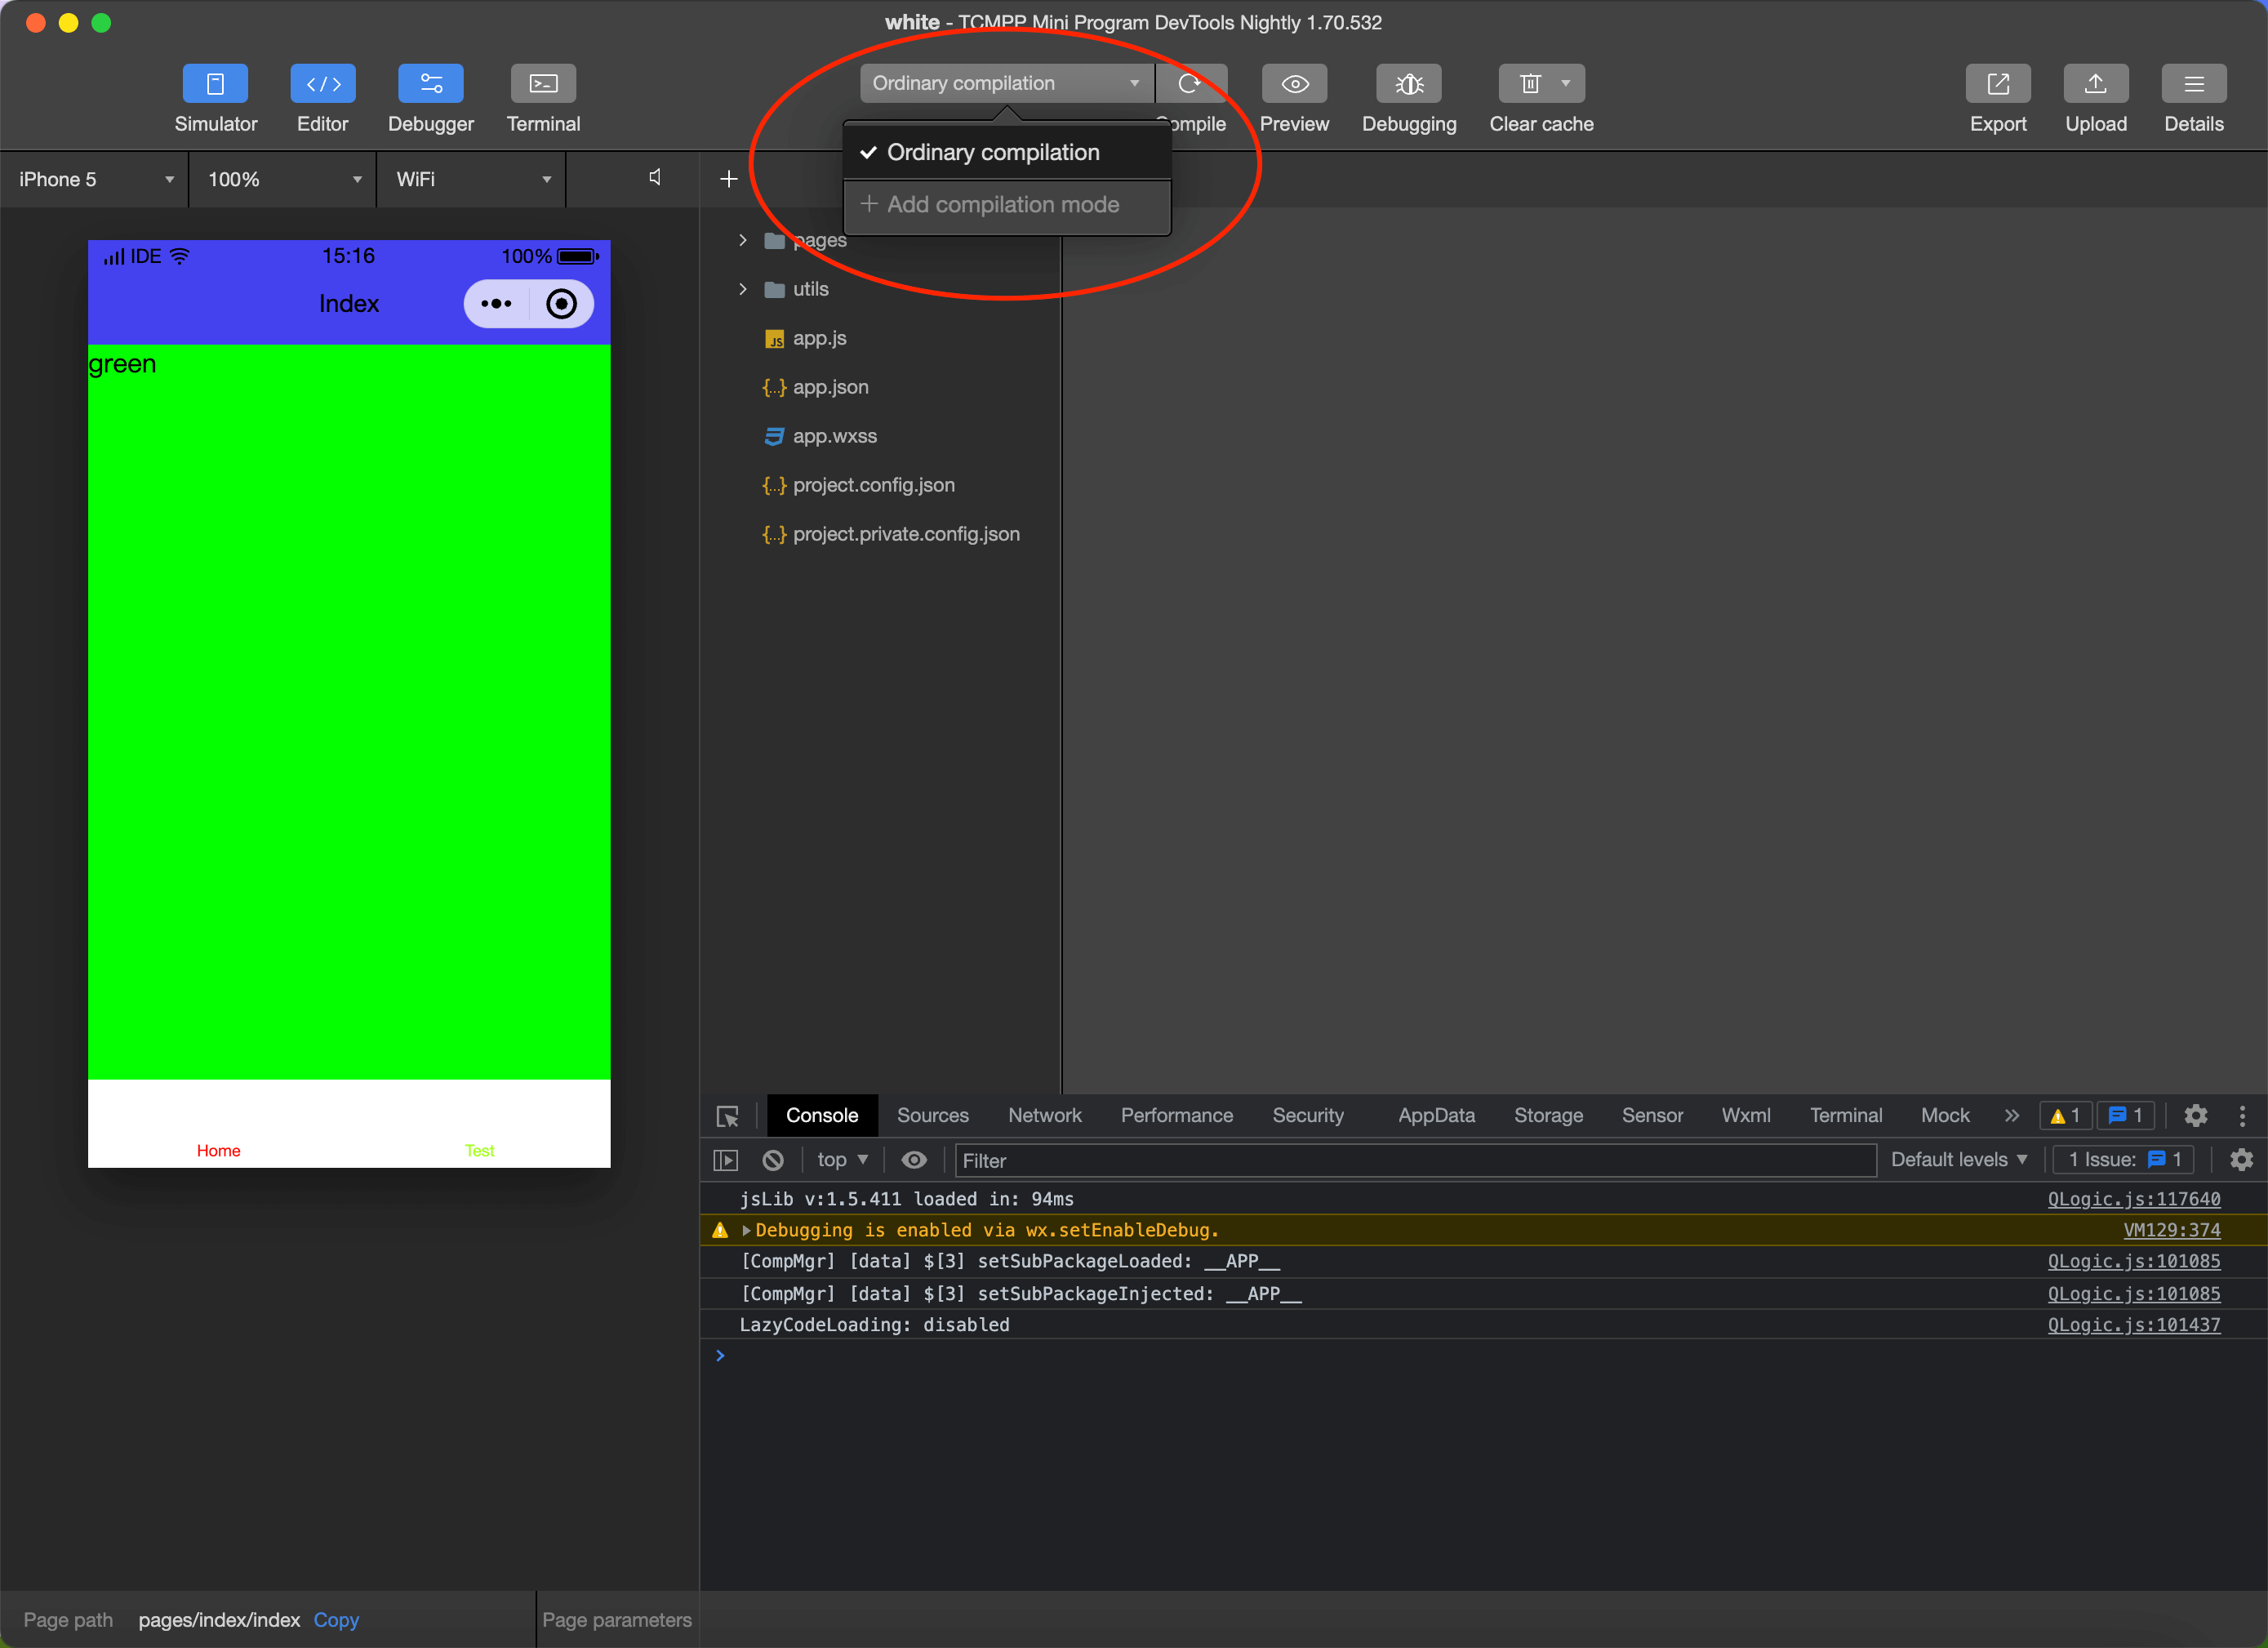
Custom compilation
Click the compile button in the toolbar or use the shortcut key Ctrl(⌘) + B to compile the current code and automatically refresh the simulator.
At the same time, in order to help developers debug and enter specific pages from different parameters, developers can add or select existing custom compilation conditions for compilation and code preview (as shown in the figure).
TIP
Compilation conditions are related to the project, and each project can save its own related compilation conditions.
Debugging tool
The debugging tool is divided into 9 major functional modules: Wxml, Console, Sources, Network, Appdata, Storage, Sensor, Mock, and Compatibility.
Wxml panel
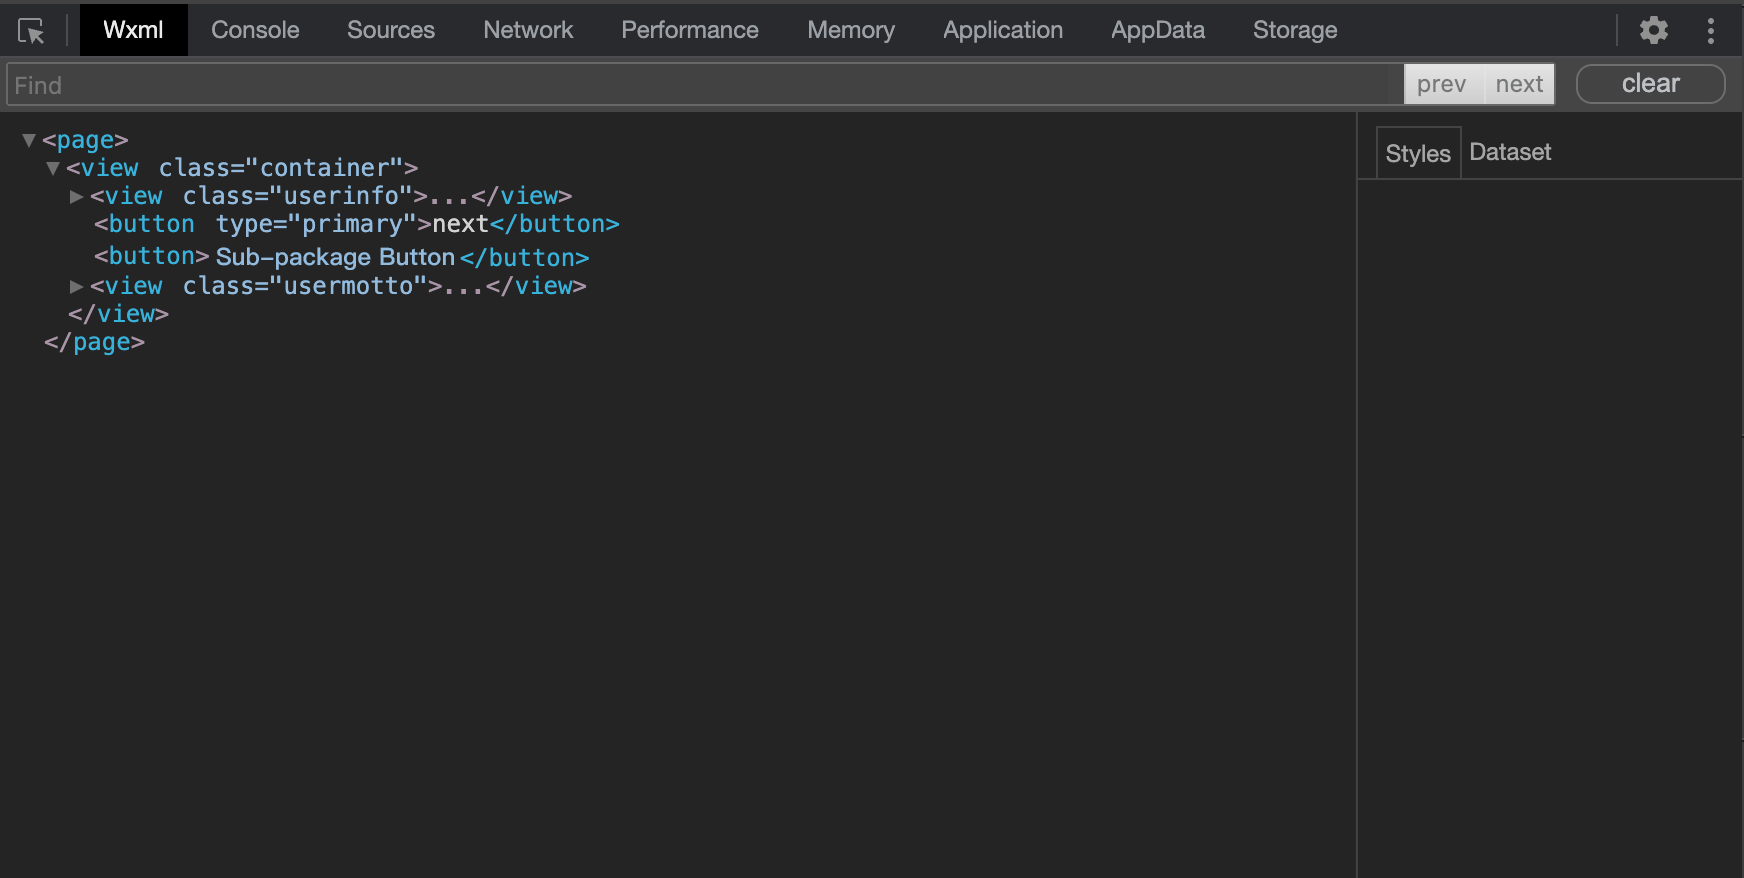
The Wxml panel is used to help developers develop interfaces after wxml conversion. Here you can see the real page structure and the wxss attributes corresponding to the structure. At the same time, you can modify the corresponding wxss attributes to see the changes in real time in the simulator (only real-time preview, cannot be saved to a file). Through the selector in the upper left corner of the debugging module, you can also quickly locate the wxml code corresponding to the component in the page.
Console panel
The Console panel has two major functions:
- Developers can enter and debug code here;
- The error output of the mini program will be displayed here.
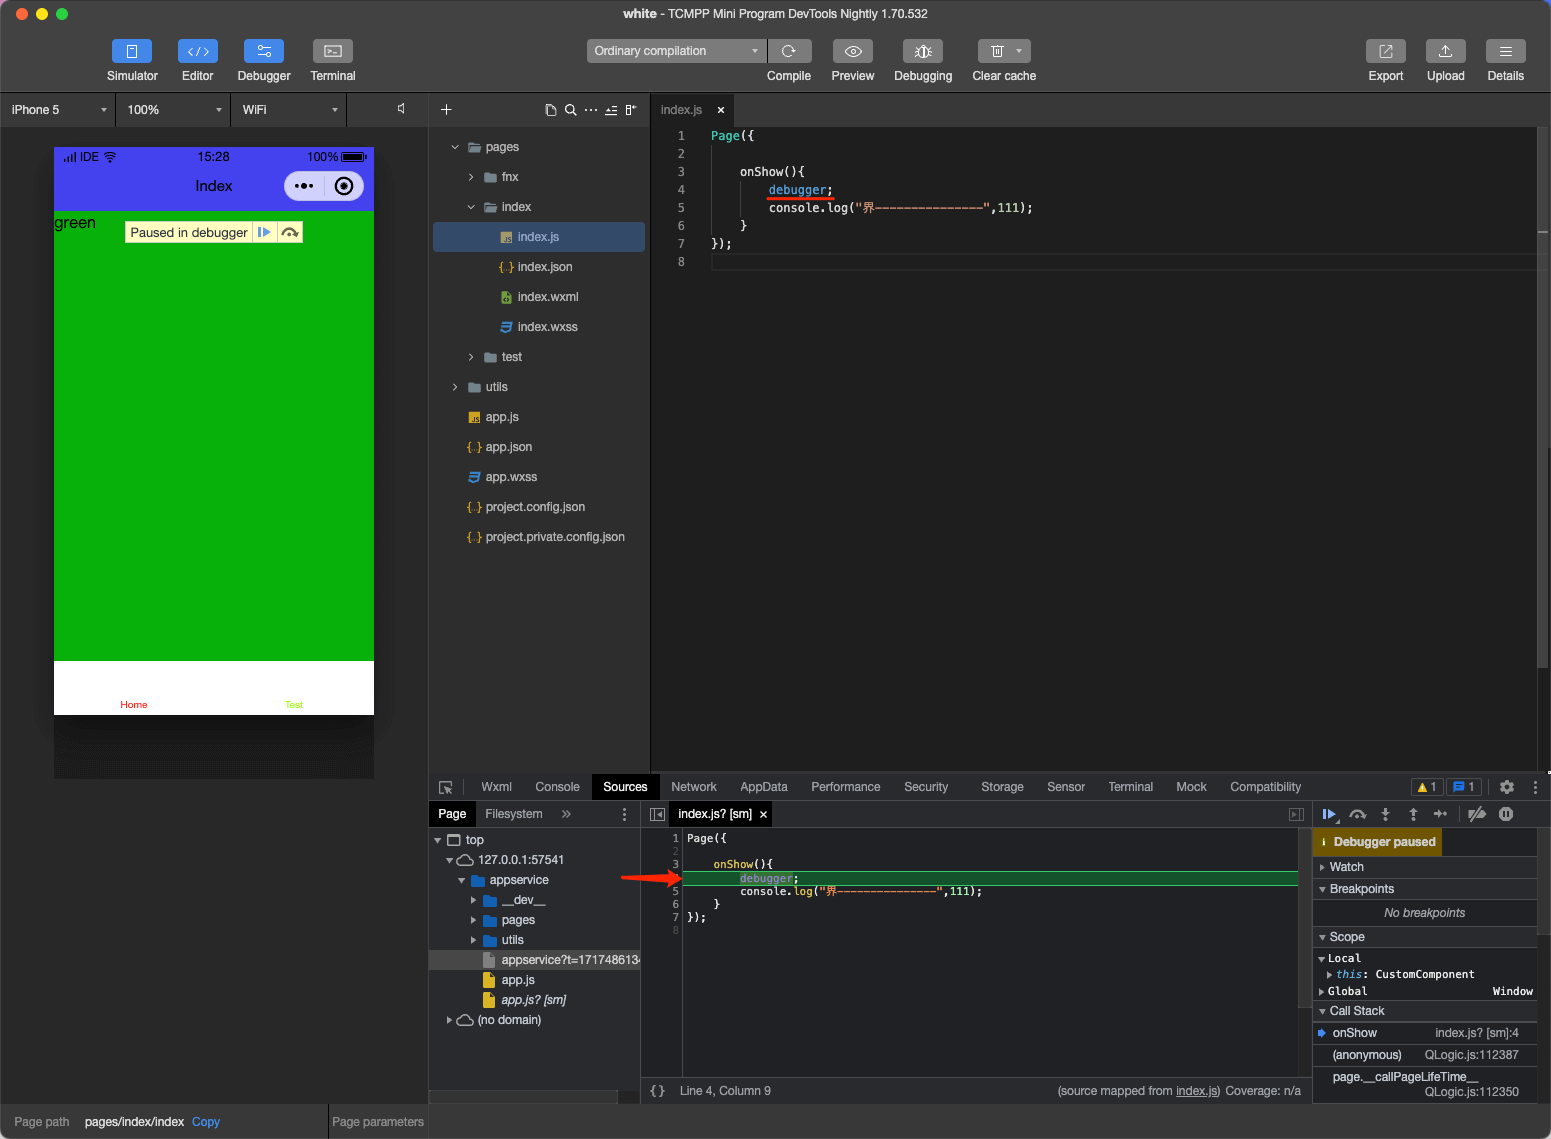
Source panel
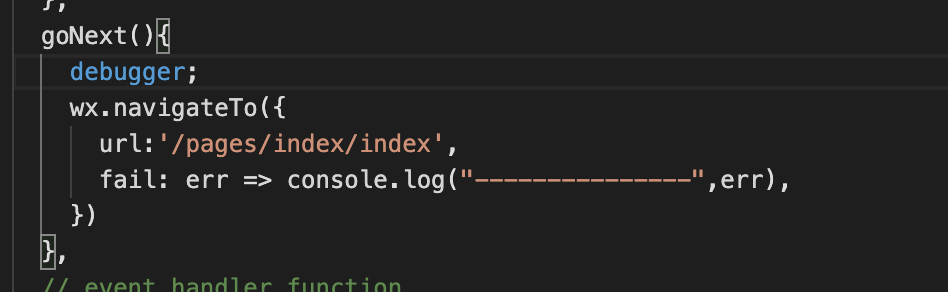
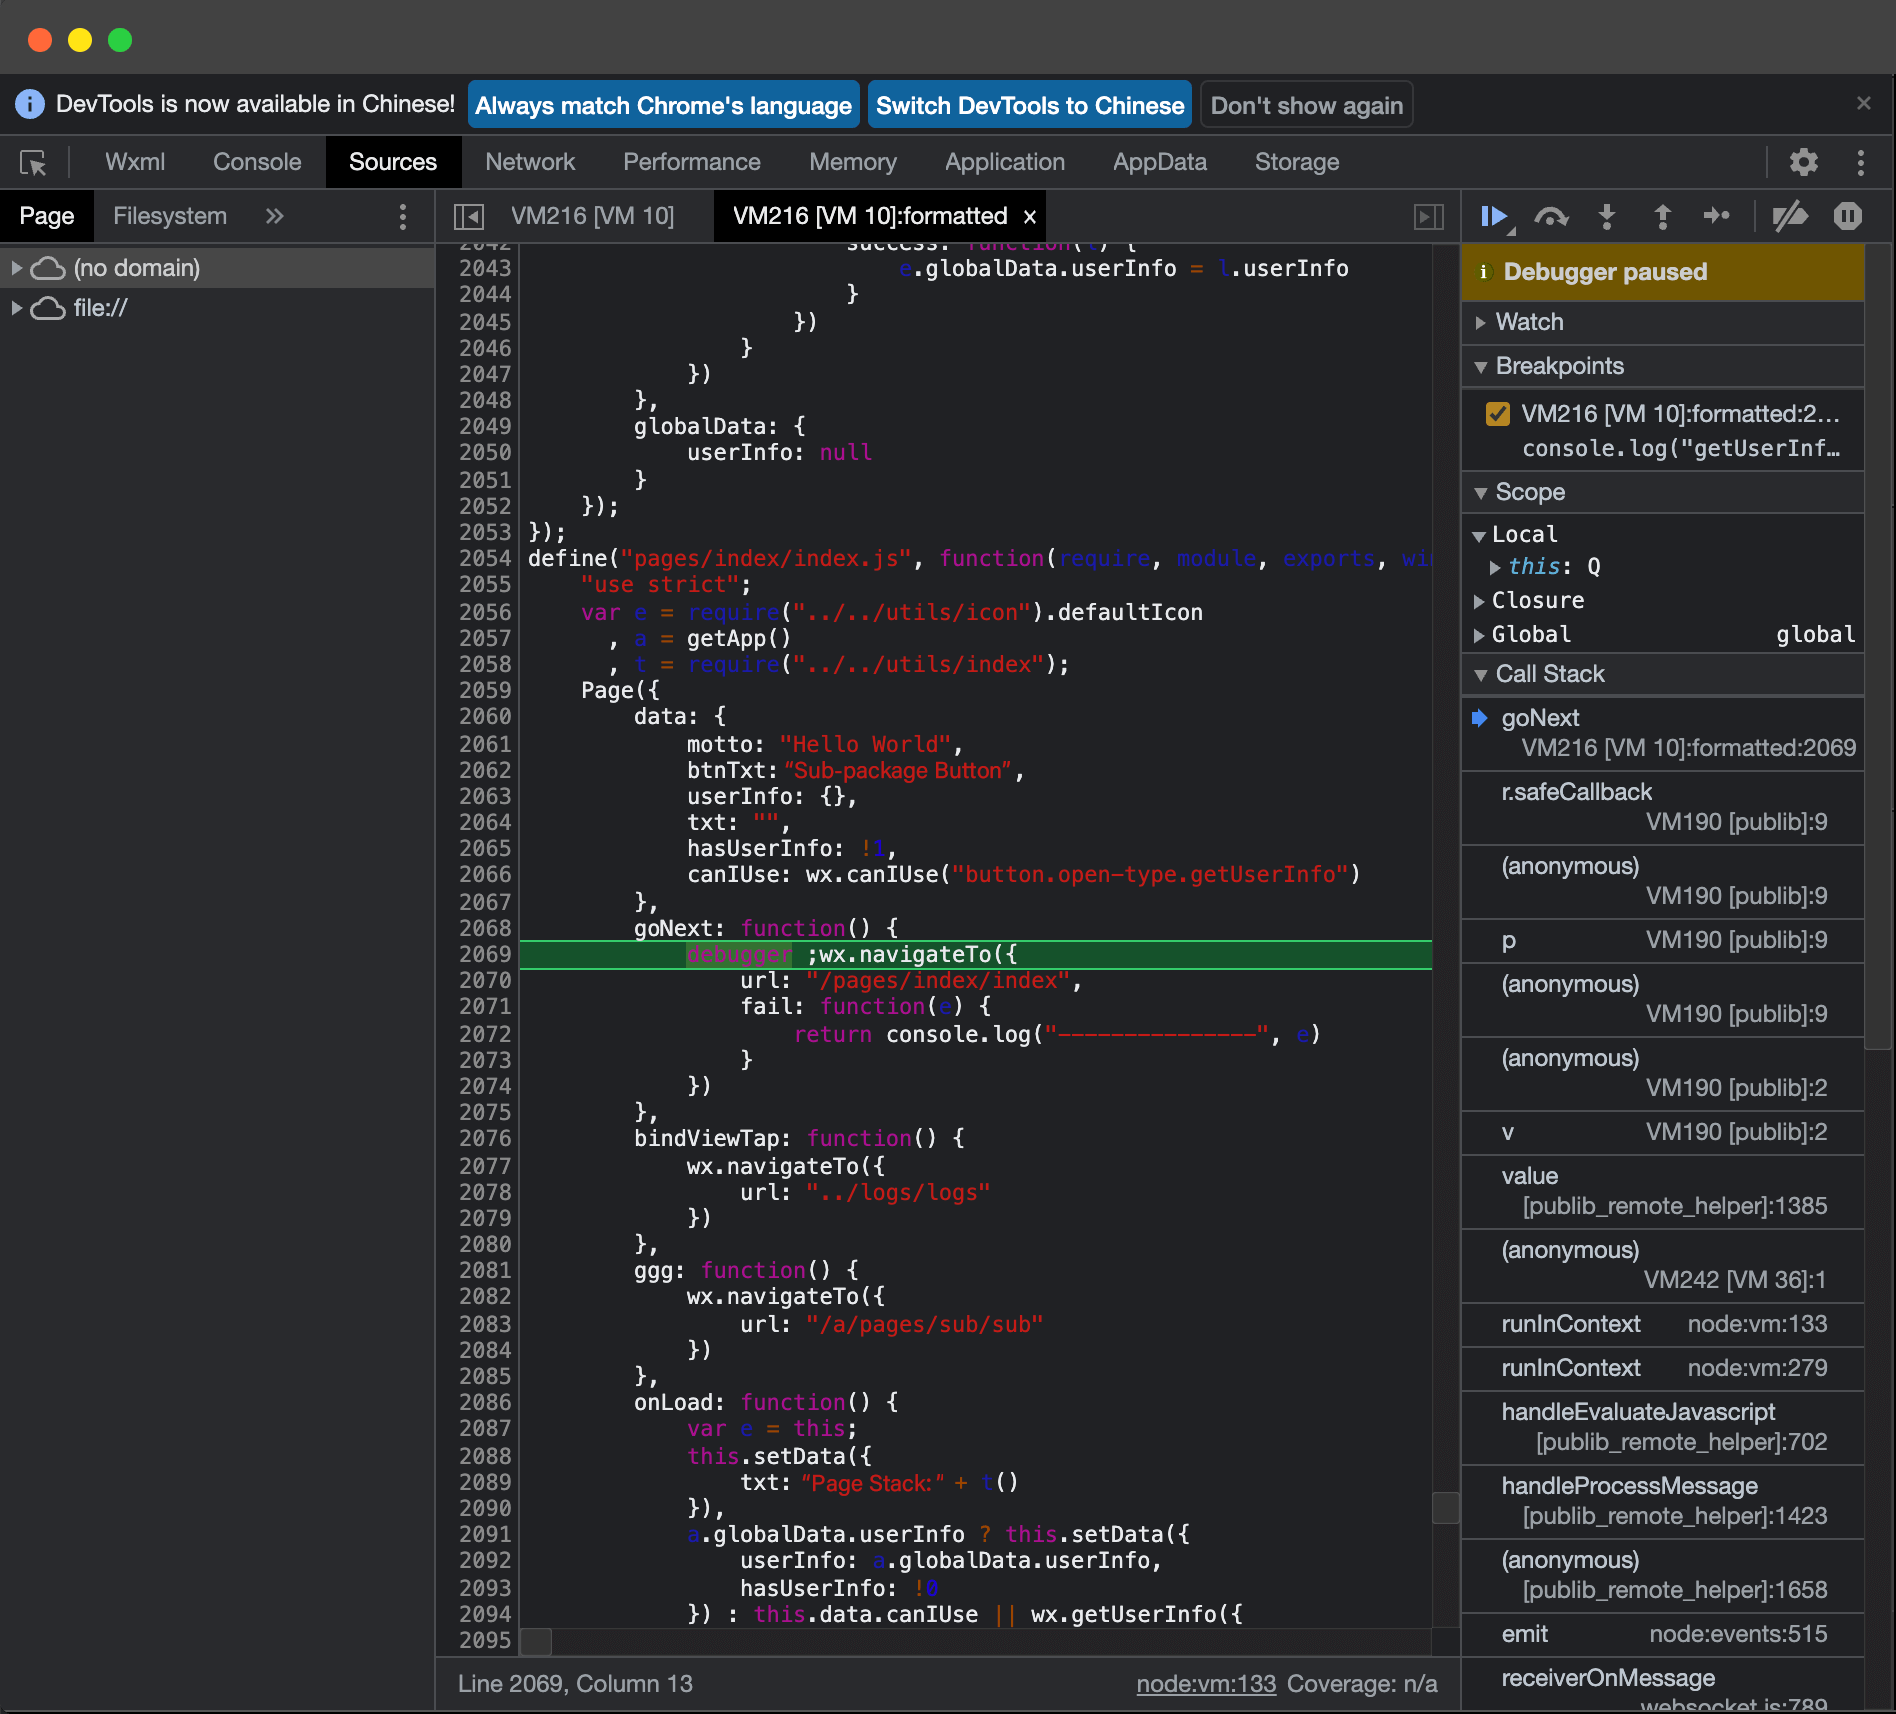
It is used to display the script files of the current project. Unlike browser development, the mini program framework will compile the script files, so the files seen by developers in the Sources panel are processed script files. The developer's code will be wrapped in the define function, and for the Page code, there will be an active call to require at the end.
Developers can add debuggers to the code; the mini program breakpoint will enter here.
Network panel
The Network Panel is used to observe and display the request status of requests and sockets.
Appdata panel
The AppData panel is used to display the specific data of the AppData of the current project when it is running, reflecting the project data status in real time. Data can be edited here and fed back to the interface in a timely manner.
Storage panel
- The Storage panel is used to display the data storage status of the current project after using wx.setStorage or wx.setStorageSync.
- Data can be deleted (press the delete key), added, and modified directly on the Storage panel.
Sensor panel
The Sensor panel has two major functions:
- Developers can choose to simulate geographic location here.
- Developers can simulate the performance of mobile devices here to debug gravity sensing APIs.
Mock panel
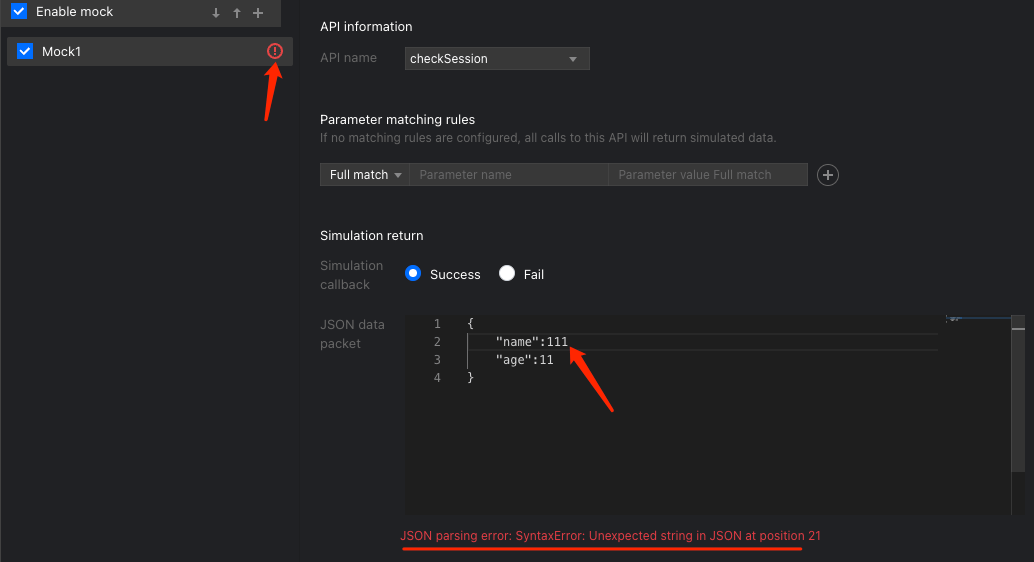
In order to make it easier for developers to develop applets, the developer tool provides the API Mock capability, which can simulate the call results of some APIs.Usually developers need to mock some custom APIs or user information implemented by containers. The following screenshots will show the use of mockAPI capabilities. In the following code snippet, the checkSession api will be mocked.
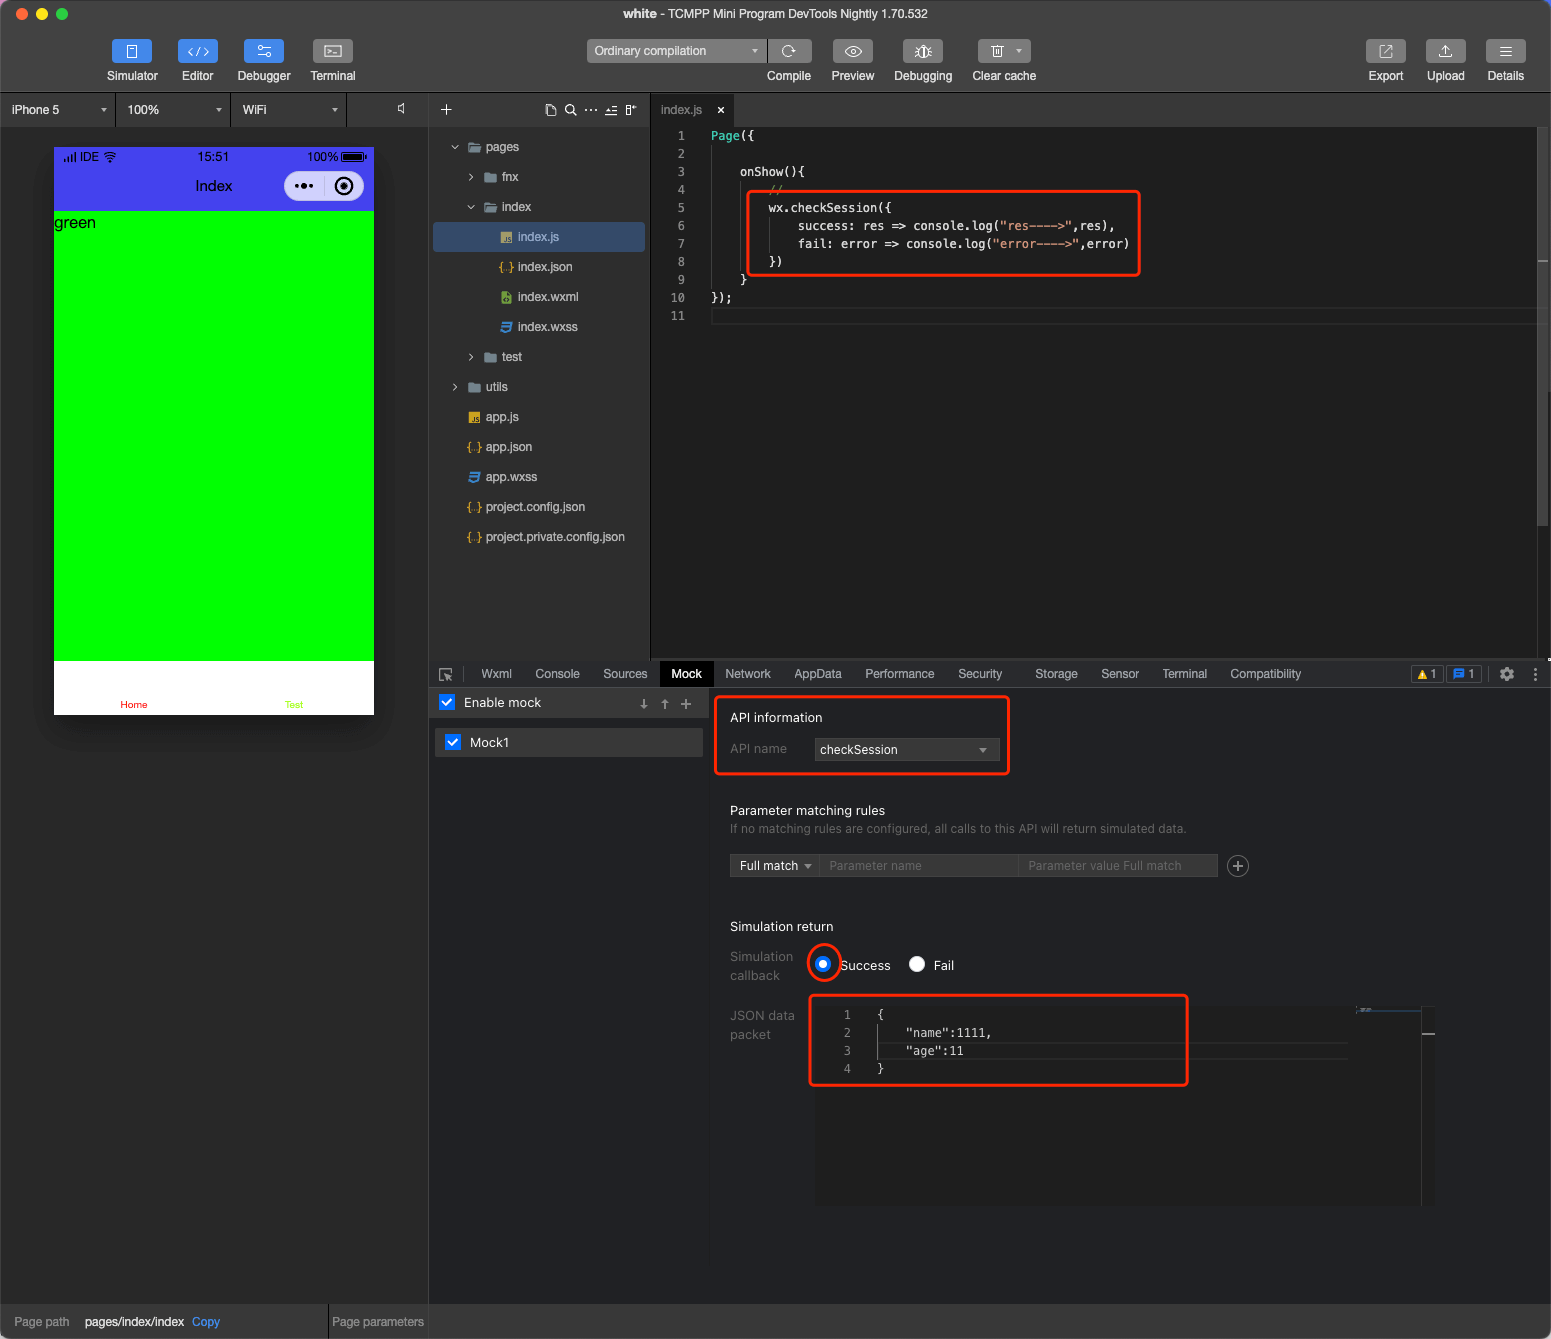
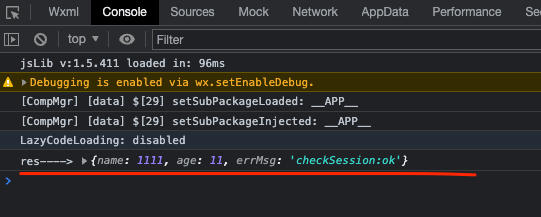
During the mock process, if there is a type error, the mock will fail and the mock will not succeed.
Compatiblity panel
Mini Program Migration Tool Compatibility
You can initiate Luffa Mini Program compatibility detection at Compatibility and click Start Detection.
The migration tool will traverse the components, APIs, json files, etc. in the current mini program. After the detection is completed, the detection results will be displayed in the window below, and the detection results can be exported as an excel file.
Remote debugging
Real machine debugging entry:
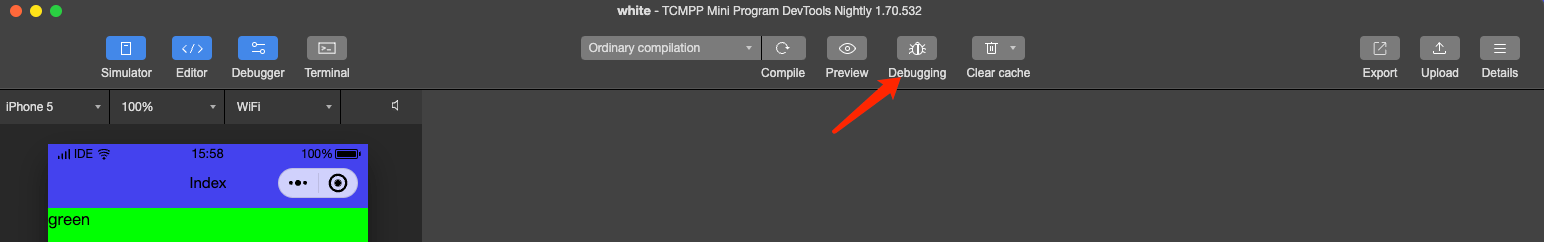
Click real machine debugging. At this time, the tool will process, package and upload the local code. When it is ready, use the mobile client to scan the QR code to pop up the debugging window and start real machine debugging.
TIP
To use real machine debugging, the Android and iOS SDK versions must be greater than 1.5.12.
Use the SDK-connected App to scan this QR code to start remote debugging.
To end debugging, just close this debugging window or click the 'End Debugging' button in the lower right corner.
The remote debugging window is divided into two parts, the debugger view on the left and the information view on the right. Developers can debug the code directly in the debugger and view the Storage status; the information view can view the current connection status with the phone and server, as well as the error information that occurred.
In the remote debugging debugger, developers can debug the code in the Console panel, view the source code of the mini program in the Sources panel and perform breakpoint single-step debugging, and view the storage usage of the mini program in the Storage panel.
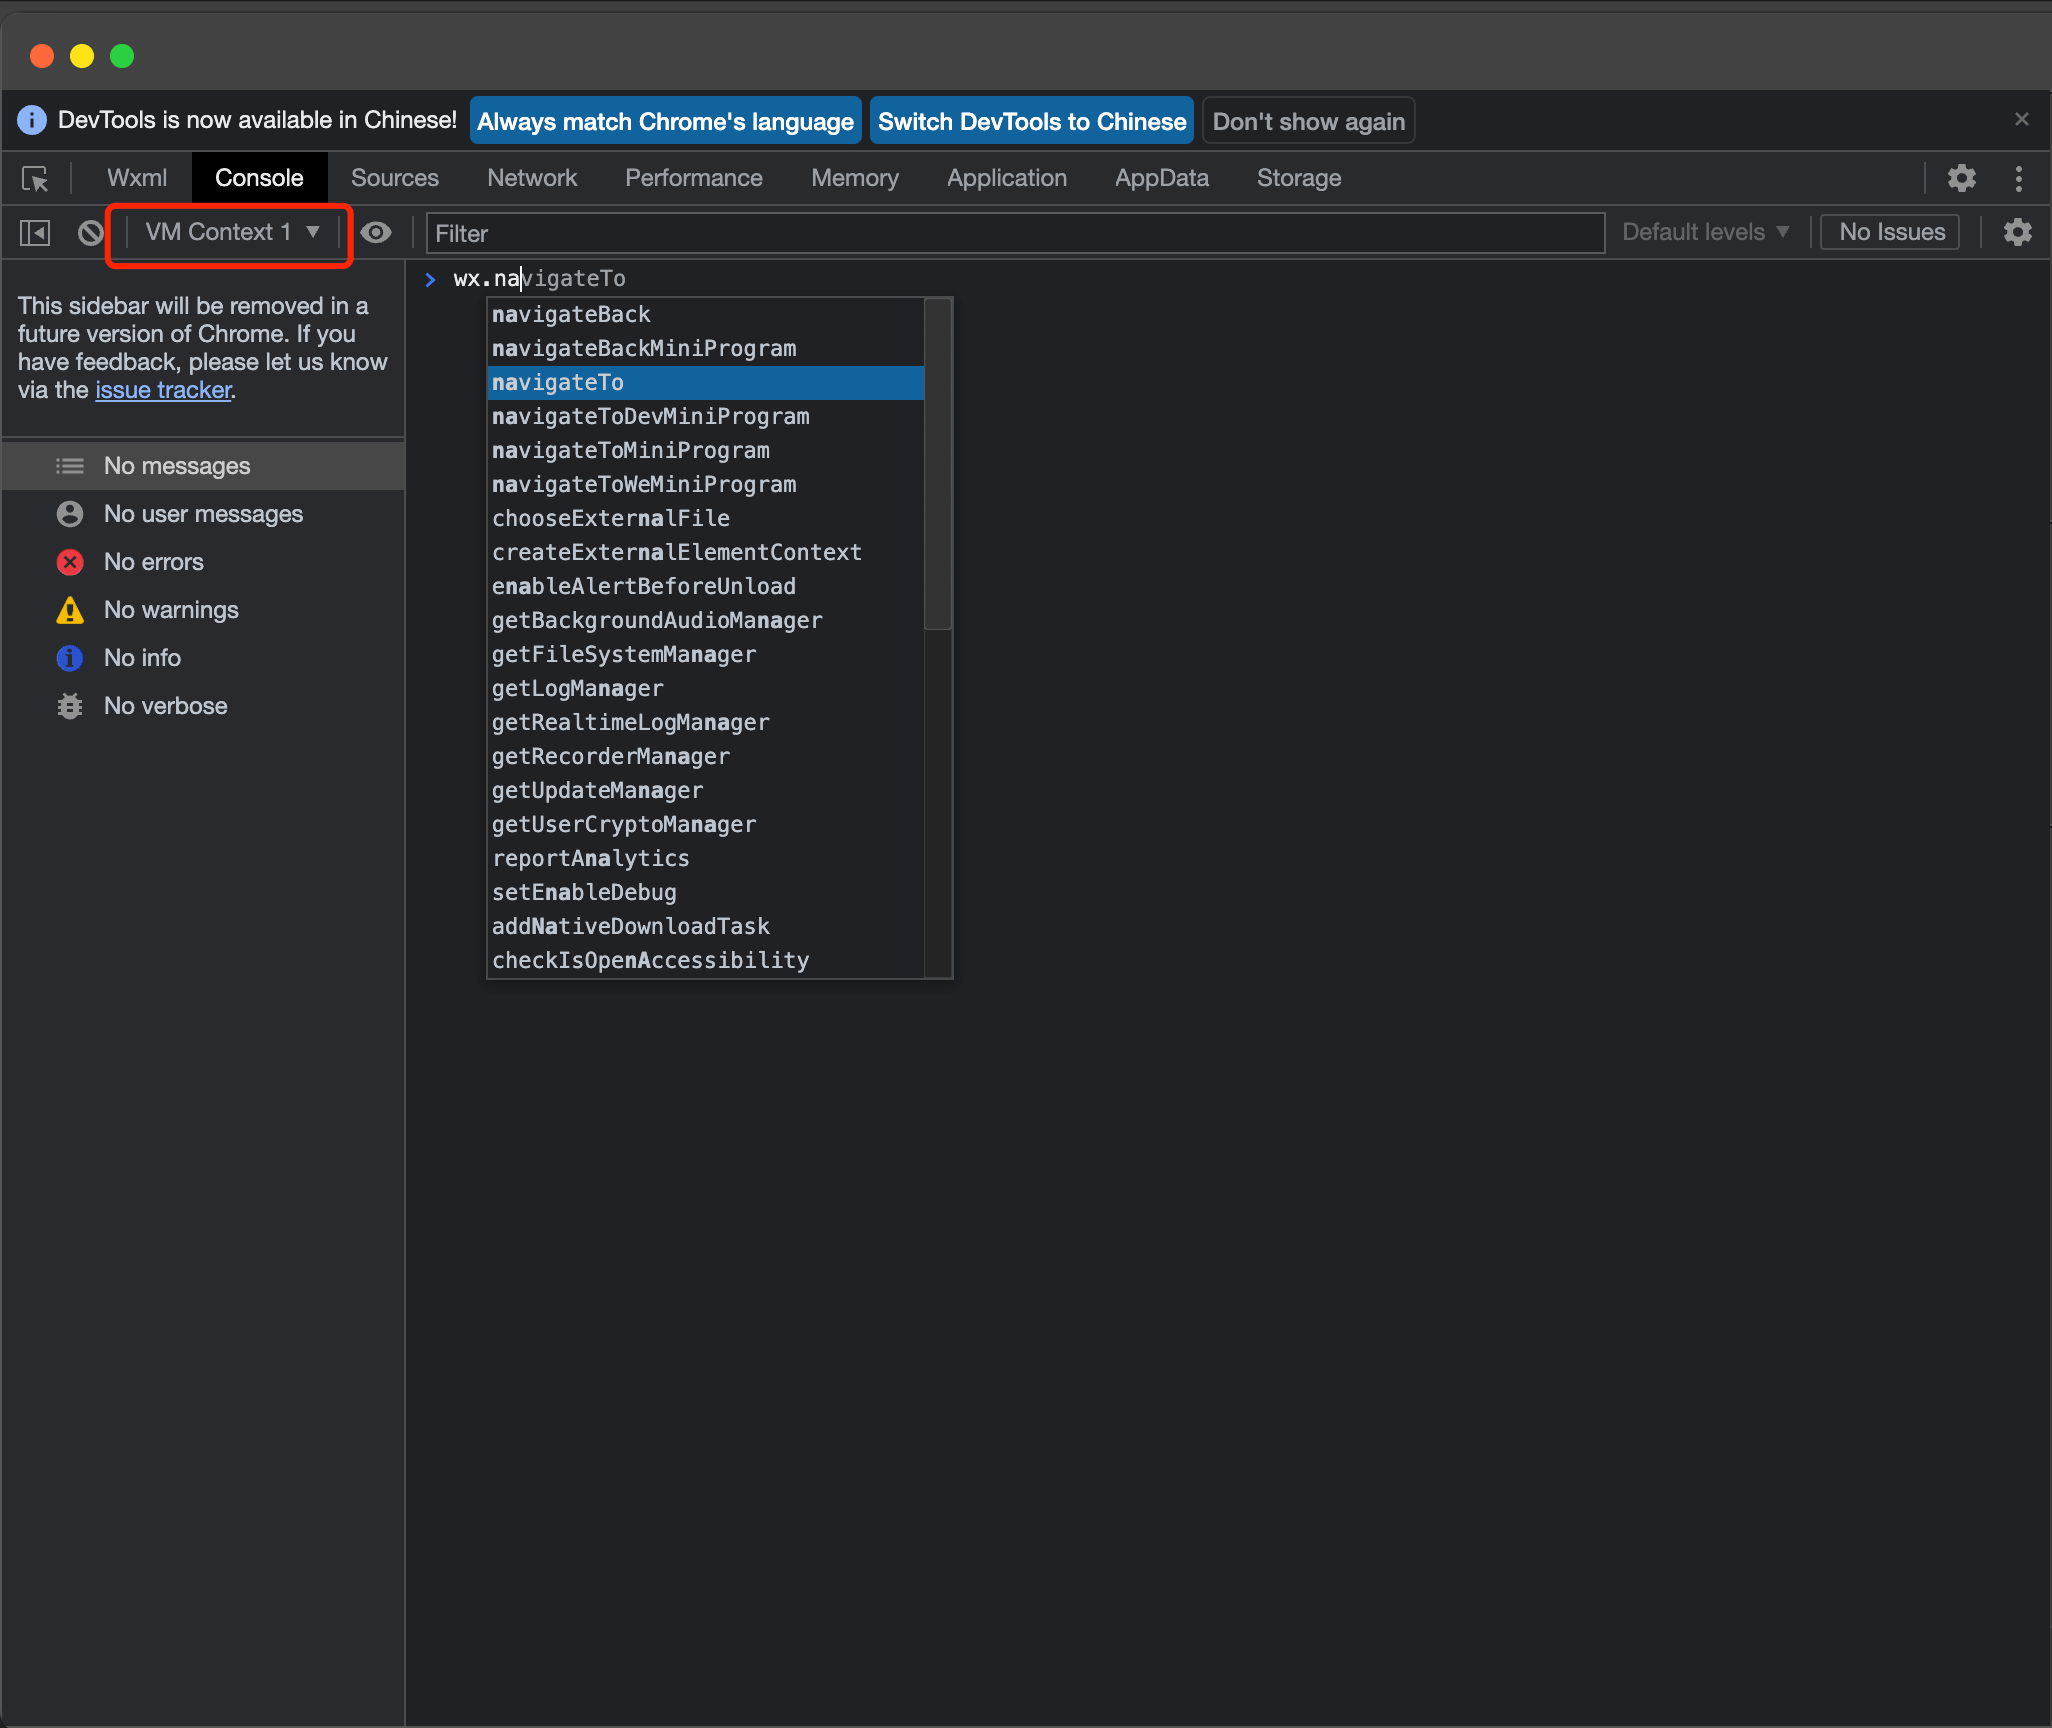
For JS breakpoint debugging, use the debugger in the code.
wxml panel:
The information view on the right shows the information of the phone and network connection. The phone information shows the phone model, system, name, host App version, and communication delay. The smaller the communication delay, the smoother the communication with the phone. Turn on the node review mode and click the element on the real machine button to view the element details.